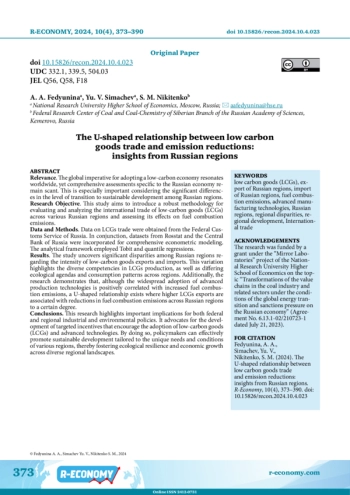
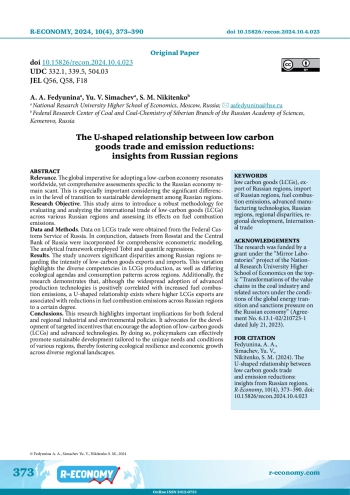
Relevance. The global imperative for adopting a low-carbon economy resonates worldwide, yet comprehensive assessments specific to the Russian economy remain scant. This is especially important considering the significant differences in the level of transition to sustainable development among Russian regions. Research Objective. This study aims to introduce a robust methodology for evaluating and analyzing the international trade of low-carbon goods (LCGs) across various Russian regions and assessing its effects on fuel combustion emissions. Data and Methods. Data on LCGs trade were obtained from the Federal Customs Service of Russia. In conjunction, datasets from Rosstat and the Central Bank of Russia were incorporated for comprehensive econometric modeling. The analytical framework employed Tobit and quantile regressions. Results. The study uncovers significant disparities among Russian regions regarding the intensity of low-carbon goods exports and imports. This variation highlights the diverse competencies in LCGs production, as well as differing ecological agendas and consumption patterns across regions. Additionally, the research demonstrates that, although the widespread adoption of advanced production technologies is positively correlated with increased fuel combustion emissions, a U-shaped relationship exists where higher LCGs exports are associated with reductions in fuel combustion emissions across Russian regions to a certain degree. Conclusions. This research highlights important implications for both federal and regional industrial and environmental policies. It advocates for the development of targeted incentives that encourage the adoption of low-carbon goods (LCGs) and advanced technologies. By doing so, policymakers can effectively promote sustainable development tailored to the unique needs and conditions of various regions, thereby fostering ecological resilience and economic growth across diverse regional landscapes.
Идентификаторы и классификаторы
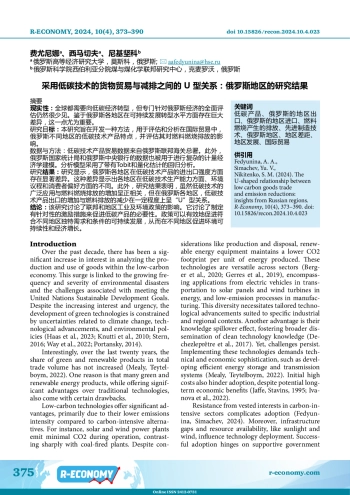
Over the past decade, there has been a significant increase in interest in analyzing the production and use of goods within the low-carbon economy. This surge is linked to the growing frequency and severity of environmental disasters and the challenges associated with meeting the United Nations Sustainable Development Goals. Despite the increasing interest and urgency, the development of green technologies is constrained by uncertainties related to climate change, technological advancements, and environmental policies (Haas et al., 2023; Knutti et al., 2010; Stern, 2016; Way et al., 2022; Portansky, 2014). Interestingly, over the last twenty years, the share of green and renewable products in total trade volume has not increased (Mealy, Teytelboym, 2022). One reason is that many green and renewable energy products, while offering significant advantages over traditional technologies, also come with certain drawbacks.
Список литературы
1. Acemoglu D., Akcigit U., Hanley D., Kerr W. (2016). Transition to clean technology. Journal of political economy, 124(1), 52-104. DOI: 10.3386/w20743
2. Aghion P., Dechezleprêtre A., Hemous D., Martin R., Van Reenen J. (2016). Carbon taxes, path dependency, and directed technical change: Evidence from the auto industry. Journal of Political Economy, 124(1), 1-51. DOI: 10.3386/w18596
3. Ali R., Bakhsh K., Yasin M. A. (2019). Impact of urbanization on CO2 emissions in emerging economy: evidence from Pakistan. Sustainable Cities and Society, 48, 101553. DOI: 10.1016/j.scs.2019.101553
4. Bashmakov I. A. (2020). Russian low carbon development strategy. Voprosy Ekonomiki, (7), 51-74. (In Russ.). DOI: 10.32609/0042-8736-2020-7-51-74
5. Bashmakov I. A. (2019). Monitoring the implementation of low carbon technologies in Russia: Opportunities for acceleration and risks of lagging behind (conclusion). Ecological Bulletin of Russia, (11), 24-29. (In Russ.).
6. Benzerrouk Z., Abid M., Sekrafi H. (2021). Pollution haven or halo effect? A comparative analysis of developing and developed countries. Energy Reports, 7, 4862-4871. DOI: 10.1016/j.egyr.2021.07.076 EDN: BBKAXC
7. Berger M., Radu D., Fonteneau R., Deschuyteneer T., Detienne G., Ernst D. (2020). The role of power-to-gas and carbon capture technologies in cross-sector decarbonisation strategies. Electric Power Systems Research, 180, 106039. DOI: 10.1016/j.epsr.2019.106039 EDN: FVPTYS
8. Bibi F., Jamil M. (2021). Testing environment Kuznets curve (EKC) hypothesis in different regions. Environmental Science and Pollution Research, 28(11), 13581-13594. DOI: 10.1007/s11356-020-11516-2 EDN: QKSLEX
9. Cole M. A. (2004). Trade, the pollution haven hypothesis and the environmental Kuznets curve: examining the linkages. Ecological Economics, 48(1), 71-81. DOI: 10.1016/j.ecolecon.2003.09.007 EDN: EUTNSX
10. Copeland B. R., Taylor M. S. (2004). Trade, growth, and the environment. Journal of Economic literature, 42(1), 7-71. DOI: 10.1257/002205104773558047
11. De Melo J., Solleder J. M. (2020). Barriers to trade in environmental goods: How important they are and what should developing countries expect from their removal. World Development, 130, 104910. DOI: 10.1016/j.worlddev.2020.104910 EDN: CZOWAI
12. Dechezleprêtre A., Ménière Y., Mohnen M. (2017). International patent families: from application strategies to statistical indicators. Scientometrics, 111, 793-828. DOI: 10.1007/s11192-017-2311-4 EDN: SPSNJQ
13. Dogan E., Inglesi-Lotz R. (2020). The impact of economic structure to the environmental Kuznets curve (EKC) hypothesis: evidence from European countries. Environmental Science and Pollution Research, 27(11), 12717-12724. DOI: 10.1007/s11356-020-07878-2 EDN: WFAUTE
14. Fedyunina A. A., Simachev Y. V. (2024). Technologies of the coal industry and low carbon economy technologies: Substitutes or complements? Naukoemkie tekhnologii razrabotki i ispol’zovaniya mineral’nykh resursov, (10), 293-297. (In Russ.).
15. Gerres T., Ávila J. P. C., Llamas P. L., San Román T. G. (2019). A review of cross-sector decarbonisation potentials in the European energy intensive industry. Journal of cleaner production, 210, 585-601. DOI: 10.1016/j.jclepro.2018.11.036
16. Gill F. L., Viswanathan K. K., Karim M. Z. A. (2018). The critical review of the pollution haven hypothesis. International Journal of Energy Economics and Policy, 8(1), 167-174.
17. Glachant M., D. Dussaux, Y. Meniere, A. Dechezlepretre. (2013). Promoting the International Transfer of Low-Carbon Technologies: Evidence and Policy Challenges. Report for the Commissariat général à la stratégie et à la prospective (French Center for Policy and Planning), MINES ParisTech, October.
18. Grossman G., Krueger A. (1991). Environmental Impacts of a North American Free Trade Agreement. National Bureau of Economic Research. DOI: 10.3386/w3914
19. Haas C., Jahns H., Kempa K., Moslener U. (2023). Deep uncertainty and the transition to a low-carbon economy. Energy Research & Social Science, 100, 103060. DOI: 10.1016/j.erss.2023.103060 EDN: KXGWIS
20. Ivanova N. A., Akhpash A. A., Dvoryanchikova A. A. (2022). Transition to a low carbon economy: Features and further development. Transport Business of Russia, (1), 31-37. (In Russ.).
21. Jaffe A. B., Stavins R. N. (1995). Dynamic incentives of environmental regulations: The effects of alternative policy instruments on technology diffusion. Journal of environmental economics and management, 29(3), S43-S63. DOI: 10.1006/jeem.1995.1060 EDN: HIOMAX
22. Kazantseva A. N. (2020). State policy for the formation and development of the ecologically pure product market: choice of tools. Izvestiya Sankt-Peterburgskogo gosudarstvennogo ekonomicheskogo universiteta, (3)123, 138-142. (In Russ.).
23. Ketenci N. (2018). The environmental Kuznets curve in the case of Russia. Russian Journal of Economics, 4(3), 249-265. DOI: 10.3897/j.ruje.4.28482 EDN: XZXTLF
24. Khrustalev E. Iu., Ratner P. D. (2015). Selecting an optimal strategy for conversion of the regional energy system to low-carbon technologies. Audit and Financical Analisis, (5), 395-400. (In Russ.).
25. Knutti R., Furrer R., Tebaldi C., Cermak J., Meehl G. A. (2010). Challenges in combining projections from multiple climate models. Journal of Climate, 23(10), 2739-2758. DOI: 10.1175/2009jcli3361.1 EDN: NAHHNT
26. Korolev M. K., Nikitenko S. M., Goosen E. V. (2024). Identifying Potential Coal Processing Production Chains Based on Patent Analytics. Khimiya v interesakh ustoychivogo razvitiya, 5, 616-622. (In Russ). DOI: 10.15372/KhUR2023506 EDN: WLMFLH
27. Mahmood H., Furqan M., Hassan M. S., Rej S. (2023). The Environmental Kuznets Curve (EKC) Hypothesis in China: A Review. Sustainability, 15(7), 6110. DOI: 10.3390/su15076110 EDN: MKAEHE
28. Mariev O. S., Davidson N. B., Emelyanova O. S. (2020). The Impact of Urbanization on Carbon Dioxide Emissions in the Regions of Russia. Journal of Applied Economic Research, 19(3), 286-309. DOI: 10.15826/vestnik.2020.19.3.014 EDN: NYSEEM
29. Mealy P., Teytelboym A. (2022). Economic complexity and the green economy. Research Policy, 51(8), 103948. DOI: 10.1016/j.respol.2020.103948 EDN: AKTBRV
30. Muhammad S., Long X., Salman M., Dauda L. (2020). Effect of urbanization and international trade on CO2 emissions across 65 belt and road initiative countries. Energy, 196, 117102. DOI: 10.1016/j.energy.2020.117102 EDN: ROWBEY
31. Nikitenko S. M., Goosen, E. V., Kavkaeva O. (2023). Modeling of flexible value chains based on clean coal processing technologies. Russian Mining Industry, S2, 126-134. (In Russ.). DOI: 10.30686/1609-9192-2023-S1-126-134
32. Pienknagura S. (2024). Trade in Low Carbon Technologies: The Role of Climate and Trade Policies. IMF working paper, WP/24/75.
33. Pigato M., Black S., Dussaux D., Mao Z., McKenna M., Rafaty R., Touboul S. (2020). Technology Transfer and Innovation for Low-Carbon Development. International Development in Focus. DOI: 10.1596/978-1-4648-1500-3
34. Popadko N. V., Naidenova V. M. (2020). Energy saving and energy efficiency improvement as a vector of development of the world energy complex. Innovations and Investments, (5), 91-95. (In Russ.).
35. Popova I., Kolmar O. (2023). Russia’s low carbon development policy: Opportunities and constraints in new economic and political reality. International Organisations Research Journal, 18(4), 62-95. DOI: 10.17323/1996-7845-2023-04-03 EDN: CRHFMY
36. Portansky A. P. (2014). Trade in goods and services related to the environment. Russian Foreign Economic Bulletin, (7), 89-96. (In Russ.).
37. Porter M., van der Linde (1995) Green and competitive. Harvard Business Review, 73(5), 120-134. EDN: CBAQFF
38. Ratner S. V. (2016). Optimization tasks for the development trajectories of regional economic systems based on environmental parameters. Drucker Bulletin, (2)10, 30-41. (In Russ.). DOI: 10.17213/2312-6469-2016-2-13-30-41
39. Shkiperova G. T. (2013). The Kuznets environmental curve as a tool for studying regional development. Economic Analysis: Theory and Practice, 19(322), 9-16. (In Russ.).
40. Stern, N. (2016). Economics: Current climate models are grossly misleading. Nature, 530(7591), 407-409. DOI: 10.1038/530407a
41. Way R., Ives M. C., Mealy P., Farmer J. D. (2022). Empirically grounded technology forecasts and the energy transition. Joule, 6(9), 2057-2082. DOI: 10.1016/j.joule.2022.08.009 EDN: ZHWMLN
42. Xie Q., Liu J. (2019). Combined nonlinear effects of economic growth and urbanization on CO2 emissions in China: evidence from a panel data partially linear additive model. Energy, 186, 115868. DOI: 10.1016/j.energy.2019.115868
43. Xu B., Lin B. (2016). A quantile regression analysis of China’s provincial CO2 emissions: where does the difference lie? Energy Policy, 98, 328-342. DOI: 10.1016/j.enpol.2016.09.003
44. Zarsky, L. (1999). Havens, halos and spaghetti: untangling the evidence about foreign direct investment and the environment. Foreign direct Investment and the Environment, 13(8), 47-74.
Выпуск
Другие статьи выпуска
Relevance The growing importance of creative industries in Russia’s economy underscores the need for effective management strategies to support the reindustrialization of second-tier cities, with a focus on socio-economic growth and the preservation of local identity. Research Objective The article aims to identify key factors that influence the development and implementation of creative reindustrialization strategies in second-tier cities. Data and Methods Using econometric modeling, the study analyzed data from 50 industrial cities in Sverdlovsk and Chelyabinsk regions (2010-2024), sourced from the Federal State Statistics Service, the Ministry of Construction, Housing and Utilities, and the Presidential Grant Foundation. Results. The study identified key factors contributing to the growth of creative industries, including the expansion of creative sector companies, proximity to regional centers, increased grant applications, the presence of manufacturing enterprises, growth in local government revenue, and the development of new housing. A comprehensive set of government support measures was proposed, encompassing infrastructure development, financial assistance, educational initiatives, informational resources, and regulatory improvements. Conclusions Essential government support to creative industries should include infrastructure development, simplified administrative procedures, tax incentives, institutional and legislative backing, and export promotion. Other support measures can be tailored to the chosen management strategy and regional needs, resulting in the creation of a flexible system centered around local identity.
Relevance. Corruption remains a persistent issue in many countries, including Kazakhstan. By exploring the relationship between the socio-economic characteristics of specific regions and corruption, this research can provide a foundation for informed policy-making and targeted anti-corruption efforts and thus help mitigate its negative impact on regional development. Research Objective. The research aims to assess the impact of corruption on regional socio-economic development in Kazakhstan through the creation and application of a multifactor corruption index. Data and Methods. The study uses official statistical data on corruption offenses and regional socio-economic indicators, including industrial production, fixed asset investments, household expenditures, unemployment rates, and foreign trade volumes. A multifactor index methodology was employed, using Pearson correlation coefficients to calculate averaged absolute values of sub-indices for each indicator. Results. The study found strong correlations between corruption and socio-economic indicators in regions like East Kazakhstan, Abay, Akmola, and Kostanay. The economic structure of these regions plays a key role: East Kazakhstan and Akmola, with dominant mining industries, are more vulnerable to corruption due to public contracts and licensing. Kostanay’s agricultural sector, central to its economy, is prone to corruption in land allocation, subsidies, and procurement. The economic importance of these sectors amplifies the impact of corruption on development, strengthening the correlation. Conversely, regions with lower index values show weaker correlations in the analysis, likely due to economic diversity, incomplete data, or less effective governance mechanisms. Conclusions. The regional specificity of the interrelation between corruption and socio-economic development in Kazakhstan necessitates tailored approaches that consider the unique conditions of each region. These findings can be of interest to policymakers and other stakeholders. The proposed methodology allows for a more precise assessment of both hidden and visible corruption risks, highlighting critical areas for implementing effective anti-corruption measures.
Relevance. Technological sovereignty in the national economy cannot be achieved without a clear understanding of the state of regional industries, particularly their level of technological maturity. This crucial factor drives investment decisions and shapes regional development strategies. However, existing methods for assessing technological development often fail to account for industries’ reliance on foreign technologies and services. Research Objective. The study explores the concept of technological maturity in the context of managing regional industrial development, focusing on the case of regional industries in Russia. Data and Methods. To evaluate the technological maturity of regional industries, we propose an index derived from normalizing key indicators that capture the critical aspects of technological maturity. The normalized indicators are aggregated using the arithmetic mean. Correlation analysis was employed to identify factors influencing technological development. The study is based on official statistics from the Federal State Statistics Service (Rosstat) for 2022. Results. Technological maturity indices are calculated for Russian regions, identifying both strengths and weaknesses. Only nine regions have achieved a medium level of technological maturity, while most remain at low levels. Additionally, many regions leading in terms of technology are highly reliant on imported technologies and services, with minimal exports of domestically developed technologies. These results highlight the need for policy measures tailored to regions’ varying needs and levels of technological maturity. Conclusions The concept of technological maturity provides a strategic framework for regional industrial development that can enhance national economic competitiveness through both embracing modern technologies and ensuring technological independence. The technological maturity index provides a valuable tool for tracking key indicators of technological sovereignty in domestic industries and identifying investment priorities to strengthen it.
Relevance. Russia is currently facing sanctions, which have had significant economic and social consequences. These crises have revealed vulnerabilities in the socio-economic system, highlighting the importance of studying them to better address current challenges and mitigate future risks. Objective. The study aims to identify the vulnerabilities in particular aspects of sustainable development across Russia’s regions during the crises of the past 15 years. Data and methods. The study draws on data from the Federal Statistical Service (Rosstat) to calculate a sustainable development index for regions, which tracks the impact of crises on their economic, social, and environmental sustainability. The index is constructed using a classical method, comprising three averaged sub-indices, each representing one of the three components of sustainable development. A higher index value indicates greater sustainability, with the impact of crises varying across regions. Results. During the 2014 crisis, regions specializing in export-oriented industries or those with a significant share of foreign capital in their economies were hit the hardest. Socially, the most vulnerable regions were those along the Chinese border in the Far East, which were impacted by trade restrictions. The 2020 pandemic had economic effects on nearly all regions, with cities of over a million people and their agglomerations suffering the most due to the abrupt suspension of the tertiary sector. The social sphere responds most quickly to crises, while the environmental component is more inert but shows a negative trend despite the crises. Conclusions. For regions with underdeveloped and monocentric economies, support measures should focus on diversifying industries, particularly those aimed at mass consumption. In coal-mining regions, it’s important to develop service sectors related to the industry during stable periods. For the Far Eastern regions, the main support measure is to stimulate industries geared towards meeting Chinese demand.
Relevance. Inter-municipal cooperation is an effective tool for addressing resource deficits faced by municipalities, and its importance has grown in today’s context of socio-economic instability. However, the success of such cooperation largely depends on a careful selection of partners, which raises the question of how the strength of ties between municipalities impacts their ability to collaborate effectively. Research objective. The aim of this study is to explore how the spatial characteristics of interdependence between municipalities influence their interactions and cooperation. Data and methods. The research draws on official statistical data from Russia’s Federal State Statistics Service (Rosstat), as well as information from investment passports and municipal socio-economic development strategies. The study employs spatial correlation methods, cartographic analysis, and general research techniques, including analysis and synthesis. Results. The inter-municipal relationships in Sverdlovsk Region are highly uneven, with significant disparities in the level of involvement across different areas. These relationships are predominantly concentrated around the region’s administrative center and its neighboring municipalities, while the northern and eastern parts exhibit the weakest connectivity. Municipalities in the Ekaterinburg urban agglomeration are the most active participants in joint projects, whereas those in the southwestern part of the region show less involvement. The northern and eastern areas, in particular, demonstrate minimal engagement in forming partnerships with other municipalities, highlighting a stark regional imbalance. Conclusions. The study confirms a strong link between the interdependence of municipalities and the extent of their cooperation. Factors such as territorial and socio-economic proximity play a key role, but additional drivers, such as national or regional policies, also significantly influence inter-municipal collaboration. Interestingly, a lack of resources among potential partners does not appear to impede cooperation.
Relevance. The well-being of citizens is a key focus of national policies worldwide. Kazakhstan, however, is characterized by significant regional disparities in social well-being, which necessitates targeted programs and investments to improve conditions in less developed areas. Research Objective. This study aims to develop a national adaptive social well-being index to evaluate and spatially map the regions of Kazakhstan. Data and Methods. The methodology included identifying indicators through a literature review and regional data, conducting an expert survey to weight them, and creating a social well-being index. A spatial analysis was then used to calculate the index for each region. Results. The social well-being index shows significant disparities across regions. Astana, Almaty, and Atyrau demonstrate strong social welfare, driven by economic growth and advanced social infrastructure. In contrast, Karaganda, Pavlodar, and Shymkent show lower social welfare, highlighting the need for targeted interventions and investments. Conclusion. The findings offer valuable insights for policymakers to design strategies for sustainable socioeconomic growth in Kazakhstan. The proposed index can help national and regional authorities monitor social well-being.
Статистика статьи
Статистика просмотров за 2025 - 2026 год.
Издательство
- Издательство
- УрФУ
- Регион
- Россия, Екатеринбург
- Почтовый адрес
- 620002, Свердловская область, г. Екатеринбург, ул. Мира, д. 19
- Юр. адрес
- 620002, Свердловская область, г. Екатеринбург, ул. Мира, д. 19
- ФИО
- Кокшаров Виктор Анатольевич (Ректор)
- E-mail адрес
- rector@urfu.ru
- Контактный телефон
- +7 (343) 3754507
- Сайт
- https://urfu.ru/ru
